


I’m sure that a number of our visitors contributed to the new solar power records set in the US in the third quarter. Happy we’re part of the rooftop revolution!
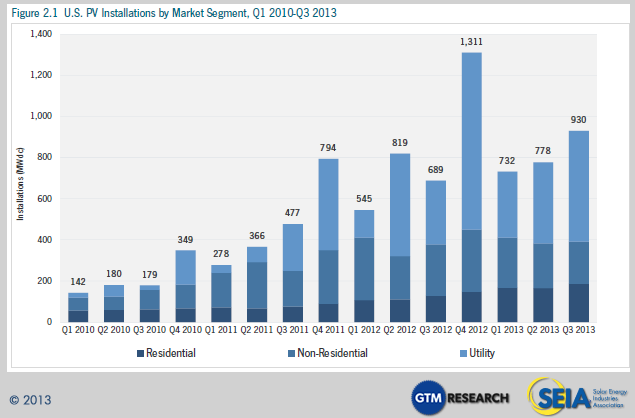
So, what are the three records to which I’m referring? According to GTM Research and the Solar Energy Industries Association (SEIA), solar panels were installed on more US residential rooftops in the third quarter of 2013 than in any previous quarter in history. Furthermore, the total solar power capacity of residential solar installations set a new record of 186 MW. Thirdly, on average, this growth was fueled by the cheapest solar panels yet.

In total, solar panels are now installed in over 400,000 locations in the US, totaling 10,250 megawatts (MW) of installed power capacity. To put that into human terms, we have enough solar power installed to provide electricity to over 1.7 million average American homes.
The 930 MW of solar power capacity installed in the third quarter was a full 35% higher than the capacity installed in the third quarter of 2012.
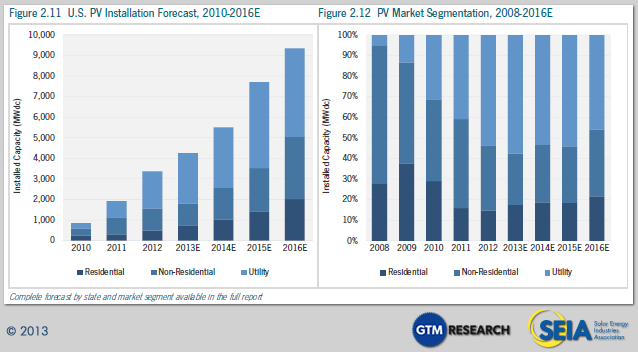
As amazing as all that is, much more is projected for the US in the coming years, and this quarter (the fourth quarter) is projected to add even more solar power capacity than was added last quarter. If the report’s projections are correct, the US will install over 5,000 MW of solar power capacity this year. That would be 27% more than last year!
For 2013 as a whole, new solar power capacity is expected to be enough to power up to 850,000 average American homes.
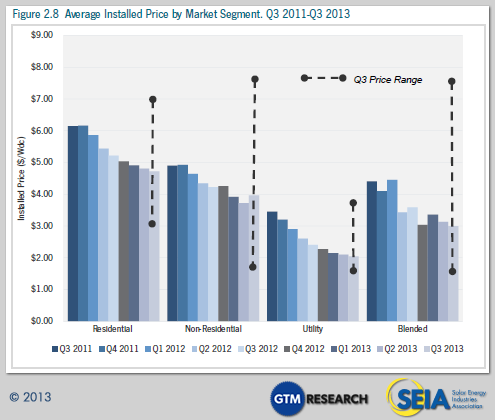
All of this growth correlates with record-low solar power prices. Lower prices result in more solar power, of course. In addition, a maturing solar market drives down costs. Look at the dramatic solar cost reduction trend that we’ve seen since Q3 2011:
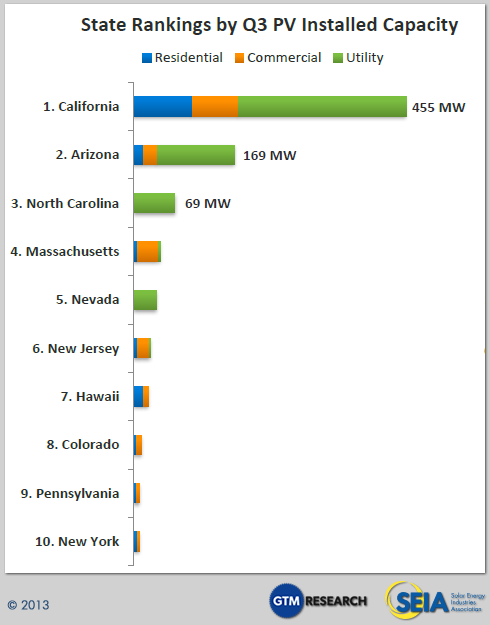
The top 5 states for solar power capacity added in Q3 2013 were California, Arizona, North Carolina, Massachusetts, and Nevada. However, you can see in the chart below that the leading states for residential solar were California, Hawaii, and Arizona — with a handful of Northeastern states following.
All of that is awesome in itself, but also note that one of the huge benefits of this solar power growth is job growth across the US.
“As the solar industry grows, so does its impact on the economy. According to The Solar Foundation’s Solar Job Census 2012, there are more than 119,000 solar workers in the U.S., a 13.2 percent increase over employment totals in 2011,” SEIA writes. “These workers are employed at 6,100 businesses operating at over 7,800 locations in every state. The increasing value of solar installations has injected life into the U.S. economy as well. In 2012, solar electric installations were valued at $11.5 billion, compared to $8.6 billion and $6 billion in 2010.”
Here’s a screenshot of SEIA’s interactive National Solar Database, which shows information on many of these solar businesses:
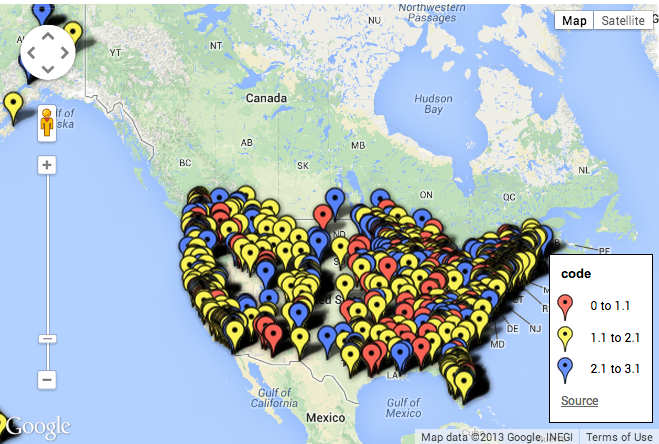
If you head over there and then zoom in, you’ll get a better vision of the staggering number of solar companies that are doing business in the US — from manufacturers to installers to large-scale solar developers.
Will you join the solar rooftop revolution in this record quarter?
For more information on the latest US solar power trends, check out the US Solar Market Insight: Q3 2013 report.
All images via SEIA, with credit to GTM Research and SEIA.
Leave a Reply
Solar Savings Calculator
Solar Savings Calculator
Get the facts. Find out exactly how much solar will save you, including which Tax and Financial programs you qualify for!

